Reports
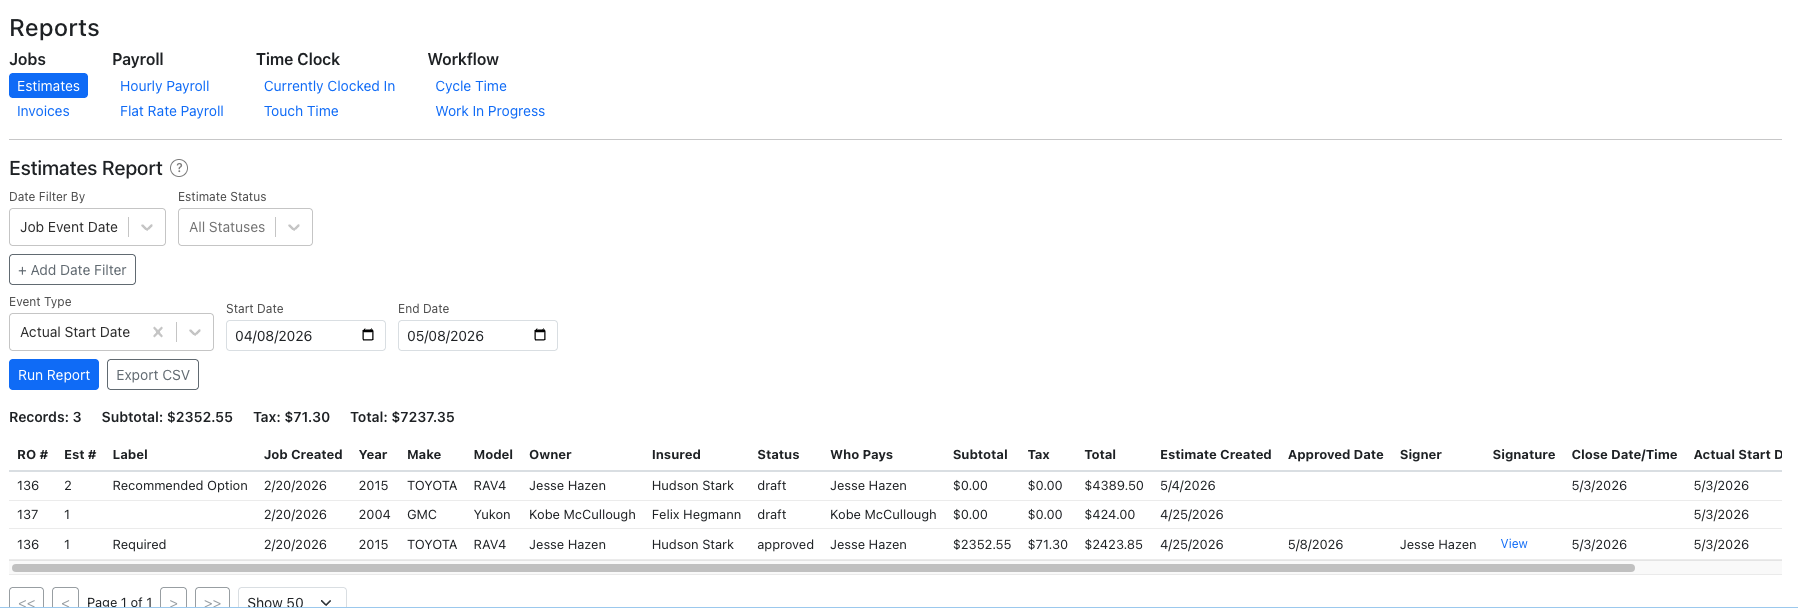
Estimates Report
Overview: View all estimates across jobs. Each row represents one estimate. Filter by job event dates, approved date, or created date. Includes signature viewing and CSV export.
Running the Report
- Go to Reports and click "Estimates" under the Jobs category.
- Choose a Date Filter By mode:
- Job Event Date — filter by when specific job events occurred. Add multiple filters to narrow results.
- Approved Date — filter by when estimates were approved.
- Created Date — filter by when estimates were created.
- Optionally filter by Estimate Status (Draft, Sent, Approved, Declined).
- Click "Run Report".
Report Columns
- RO #, Estimate #, Label, Job Created, Year, Make, Model, Owner, Insured
- Status, Who Pays (person's name), Subtotal, Tax, Total
- Estimate Created, Approved Date, Signer name
- Signature — click "View" to open the approval signature in a modal
- Dynamic event date columns based on results
Summary & Export
- Summary bar shows record count, subtotal, tax, and total.
- Sort by any column, paginate results, and export to CSV.
Invoice Report
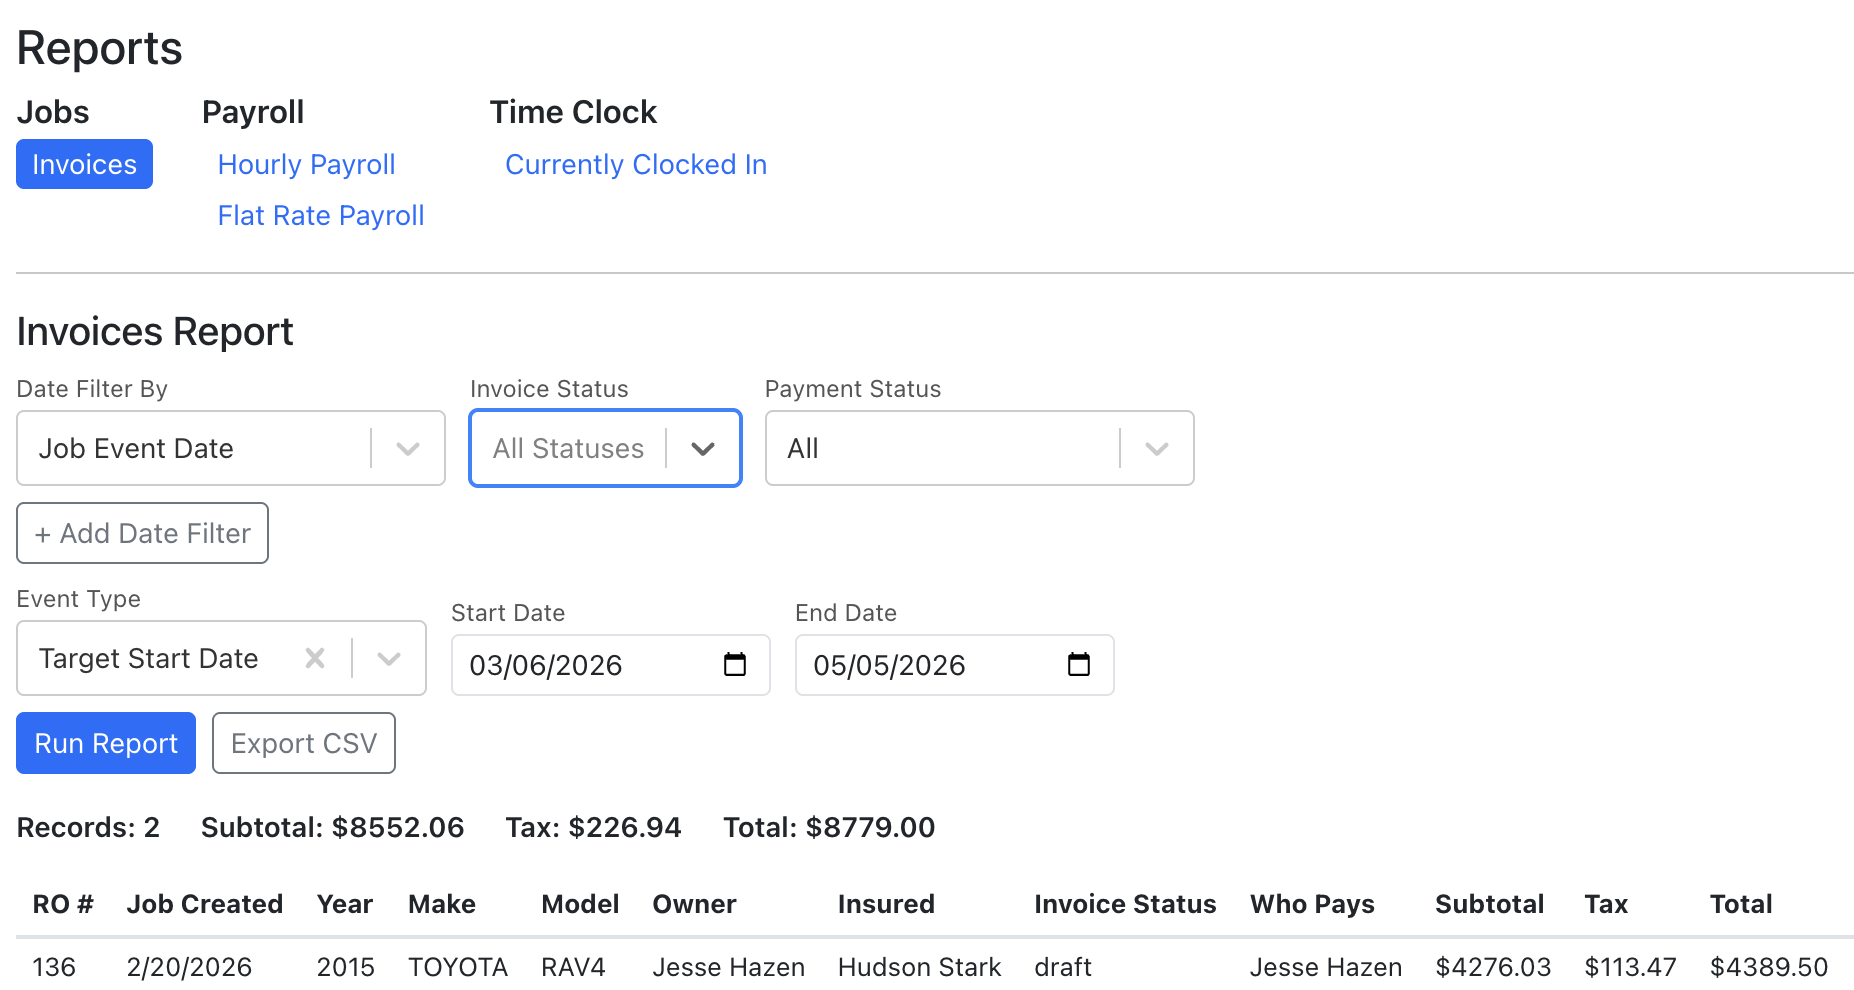
Overview: Generate reports on invoices across all jobs. Filter by date (using job events, paid date, or due date), invoice status, and payment status. Sort by any column and export to CSV.
Running the Report
- Go to Reports from the side menu.
- Click "Invoices" under the Jobs category.
- Choose a Date Filter By mode (see below).
- Optionally filter by Invoice Status (Draft, Open, Paid, Void) — you can select multiple.
- Optionally filter by Payment Status (All, Fully Paid, or Not Fully Paid).
- Click "Run Report".
Date Filter Modes
- Job Event Date — Filter by when specific job events occurred (e.g., "Vehicle Dropped Off" between two dates). You can add multiple event date filters to narrow results further.
- Paid Date — Filter by the date invoices were paid. Enter a start and end date.
- Due Date — Filter by invoice due date. Enter a start and end date.
Report Columns
The report displays the following columns:
- RO #, Job Created, Year, Make, Model, Owner, Insured
- Invoice Status, Who Pays
- Subtotal, Tax, Total, Amount Due, Amount Paid
- Invoice Date, Due Date, Finalized Date, Paid Date
- Dynamic event date columns (appear based on events present in the results)
Summary & Export
- A summary bar shows the total record count, subtotal, tax, and grand total for all matching rows.
- Click any column header to sort ascending or descending.
- Use the pagination controls at the bottom to navigate results (25, 50, or 100 rows per page).
- Click "Export CSV" to download all results as a CSV file.
Cycle Time Report
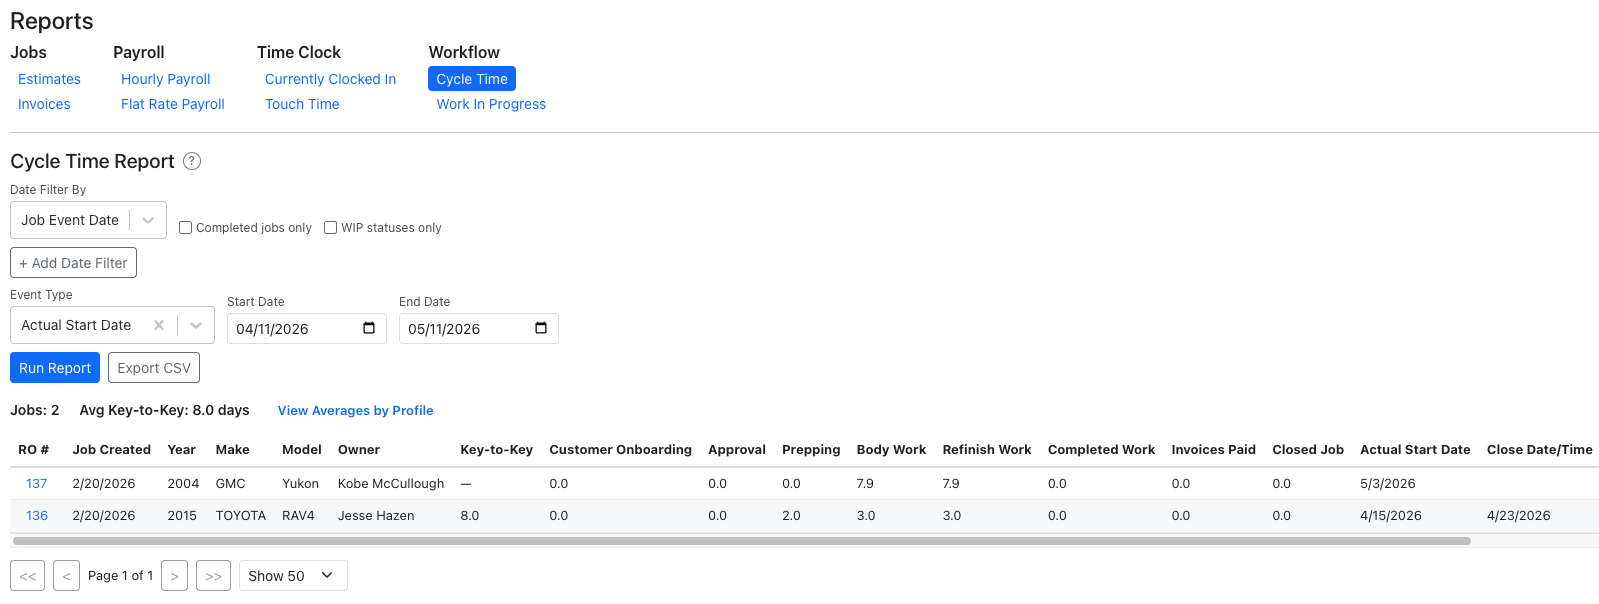
Overview: Measure how long jobs spend in each workflow step and the overall key-to-key time (arrival to pickup). Helps identify bottlenecks and track shop efficiency.
Running the Report
- Go to Reports and click "Cycle Time" under the Workflow category.
- Choose a Date Filter By mode:
- Arrival Date — filter by when vehicles arrived (shortcut for the "arrival" event).
- Pickup Date — filter by when vehicles were picked up.
- Job Event Date — filter by any event type with multiple date filters.
- Optionally check Completed jobs only to exclude jobs still in progress.
- Optionally check WIP statuses only to show only production steps in the columns.
- Click "Run Report".
How Cycle Time is Calculated
- Key-to-Key — elapsed days from the vehicle's arrival date to the actual pickup date (from repair events). Shows "—" if either date is missing.
- Status columns — time from when a status was moved to In Progress until it was marked Completed. Measured in days with 1 decimal precision.
- If a status is reset and restarted, both active periods are added together.
- Statuses marked Completed directly (skipping In Progress) show 0 days.
- Only SHOP audience statuses are shown, in the order configured in your workflow profile.
Additional Features
- View Averages by Profile — opens a modal showing average days per status, grouped by workflow profile, plus the overall key-to-key average.
- Click RO # — opens a detail modal showing the full workflow transition history for that job (who changed what, when).
- Click the ? icon next to the title for a quick reference of how calculations work.
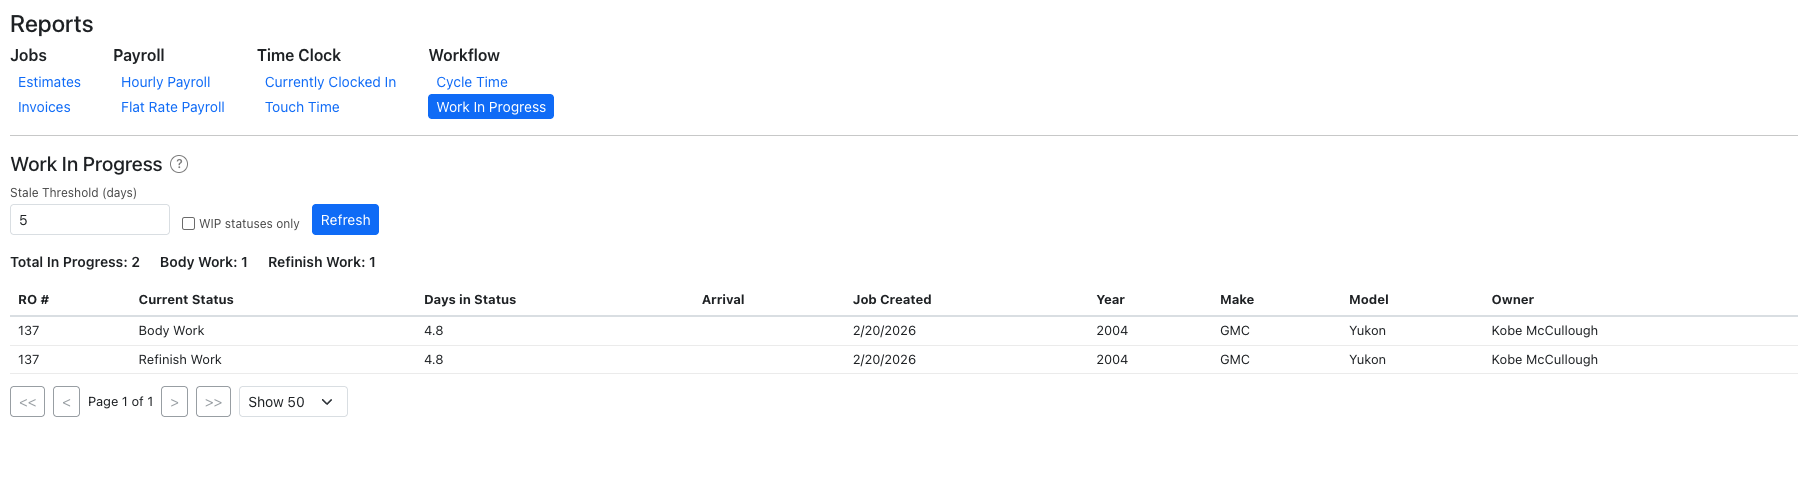
Work In Progress Report
Overview: A live snapshot of all jobs that are not yet fully completed. Shows which workflow step each job is in and how long it's been there. Useful for daily standups and identifying stale jobs.
Using the Report
- Go to Reports and click "Work In Progress" under the Workflow category.
- The report loads automatically — no date range needed since it's a current snapshot.
- Set the Stale Threshold (default 5 days) — jobs exceeding this are highlighted in yellow.
- Toggle Include Not Started to also show statuses that haven't begun yet. When enabled, you see the full picture of incomplete work — not just what's actively being worked on.
- Toggle WIP statuses only to focus on statuses marked as production steps in your workflow profile.
- Click Refresh to update the data.
What You See
- Each row is one active or not-started status on a job. A job can appear multiple times if it has multiple incomplete statuses (e.g., Body and Refinish).
- Days in Status — for In Progress statuses, measured from when the status was last moved to In Progress. Not Started statuses show 0.
- Summary bar shows the count of jobs in each status.
- Yellow highlighted rows indicate jobs that have exceeded the stale threshold.
Touch Time Report
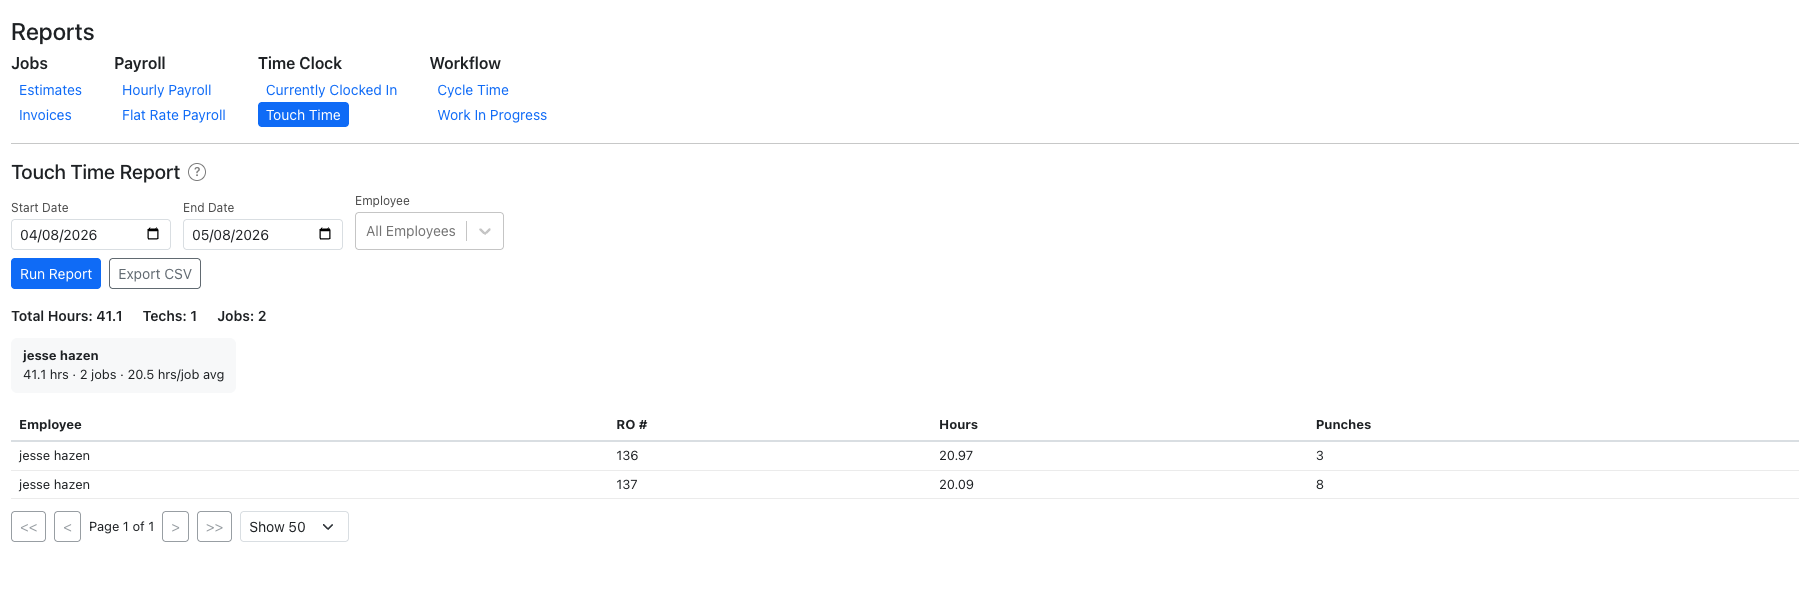
Overview: Shows actual time technicians spent on jobs based on clock-in/clock-out punches. Useful for workload visibility and comparing actual time vs. flat rate estimates.
Running the Report
- Go to Reports and click "Touch Time" under the Time Clock category.
- Select a date range.
- Optionally filter by Employee to focus on one tech.
- Click "Run Report".
What You See
- Each row is one employee + one job, showing total hours and number of punches for that combination.
- Summary cards at the top show per-tech totals: hours worked, jobs touched, and average hours per job.
- Only completed punches (with a clock-out) on a specific job are included.
- Export to CSV for payroll or analysis.
Hourly Payroll Report
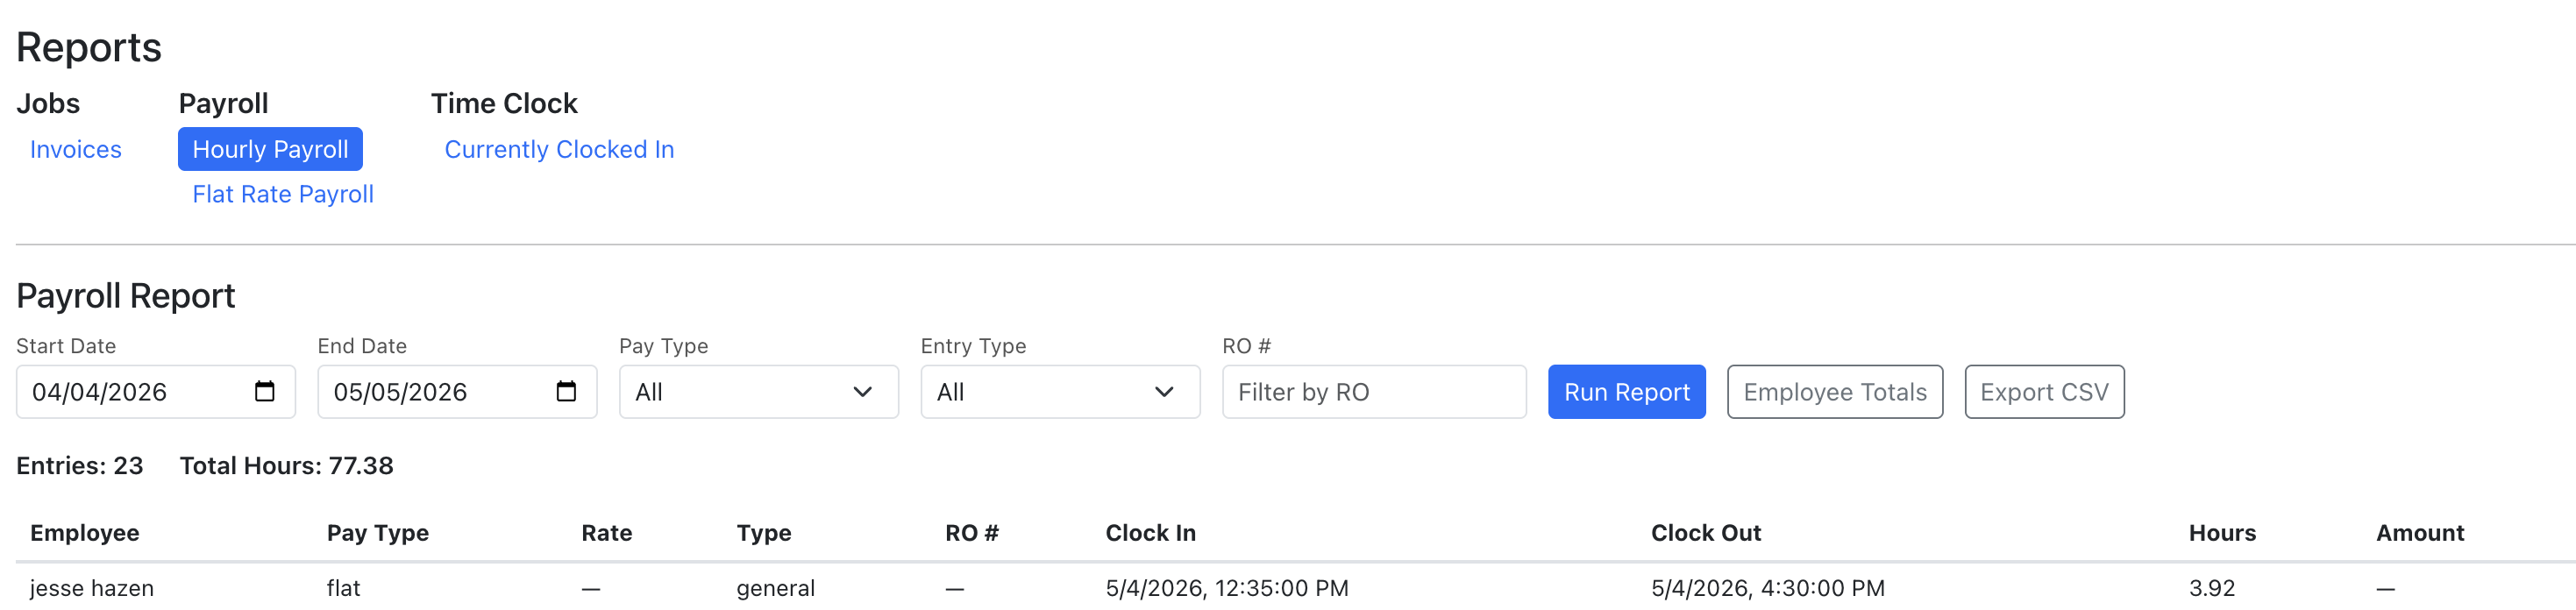
Overview: View time clock hours by employee for a date range. Shows general and job-specific hours.
- Go to Reports and click "Hourly Payroll" under Payroll.
- Select a date range.
- Click "Run Report".
Flat Rate Payroll Report
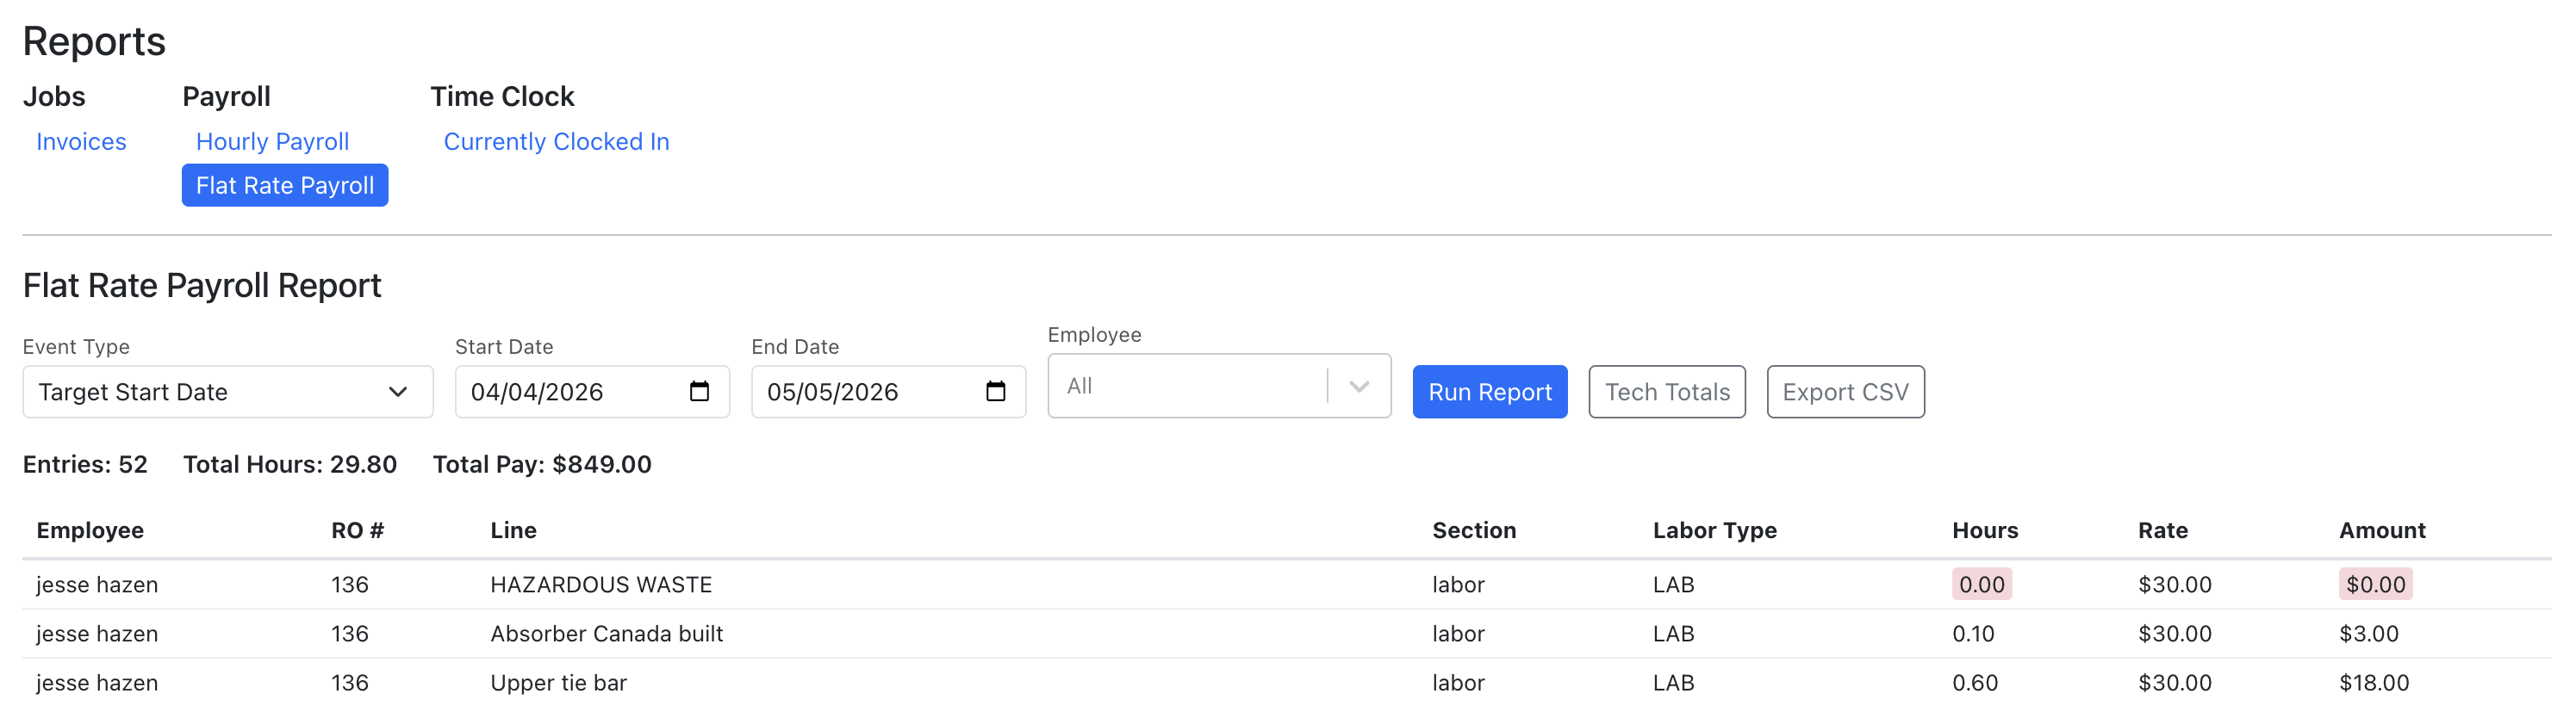
Overview: View labor hours assigned to each technician across jobs for flat rate pay calculations.
- Go to Reports and click "Flat Rate Payroll" under Payroll.
- Select a date range.
- Click "Run Report".
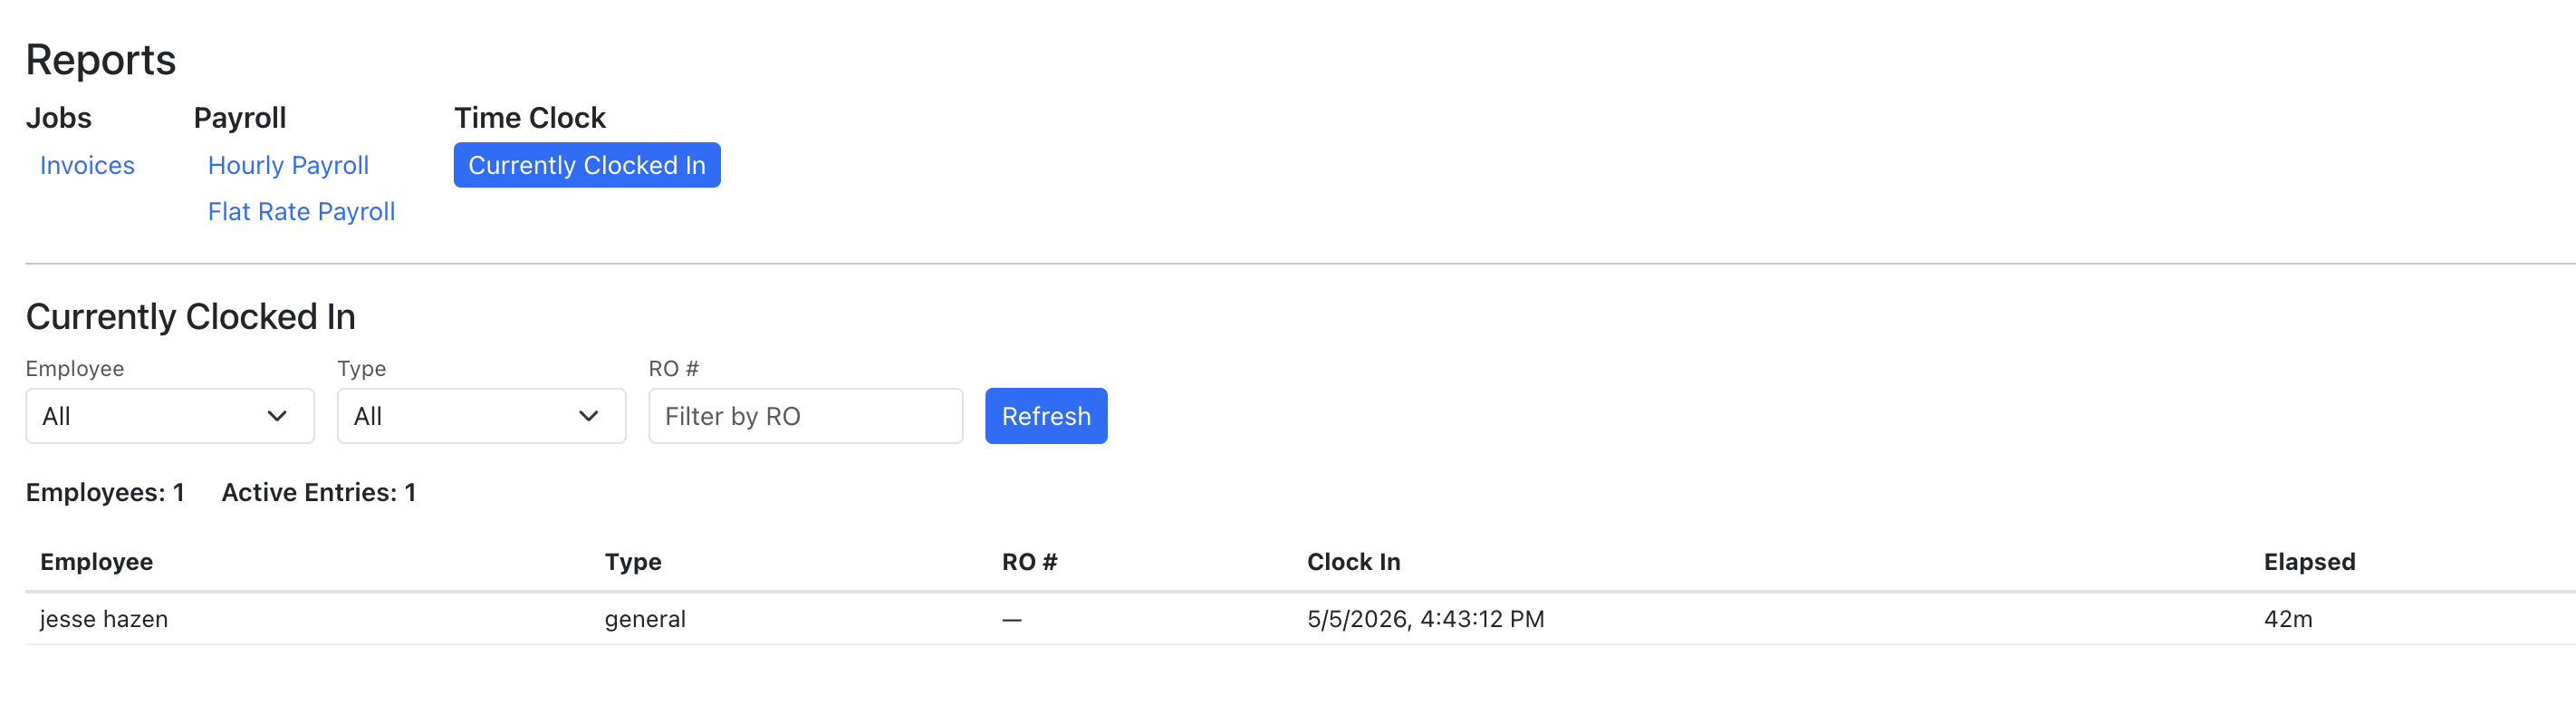
Currently Clocked In
Overview: See which employees are currently clocked in and what jobs they are punched into.
- Go to Reports and click "Currently Clocked In" under Time Clock.
Job Profitability Report
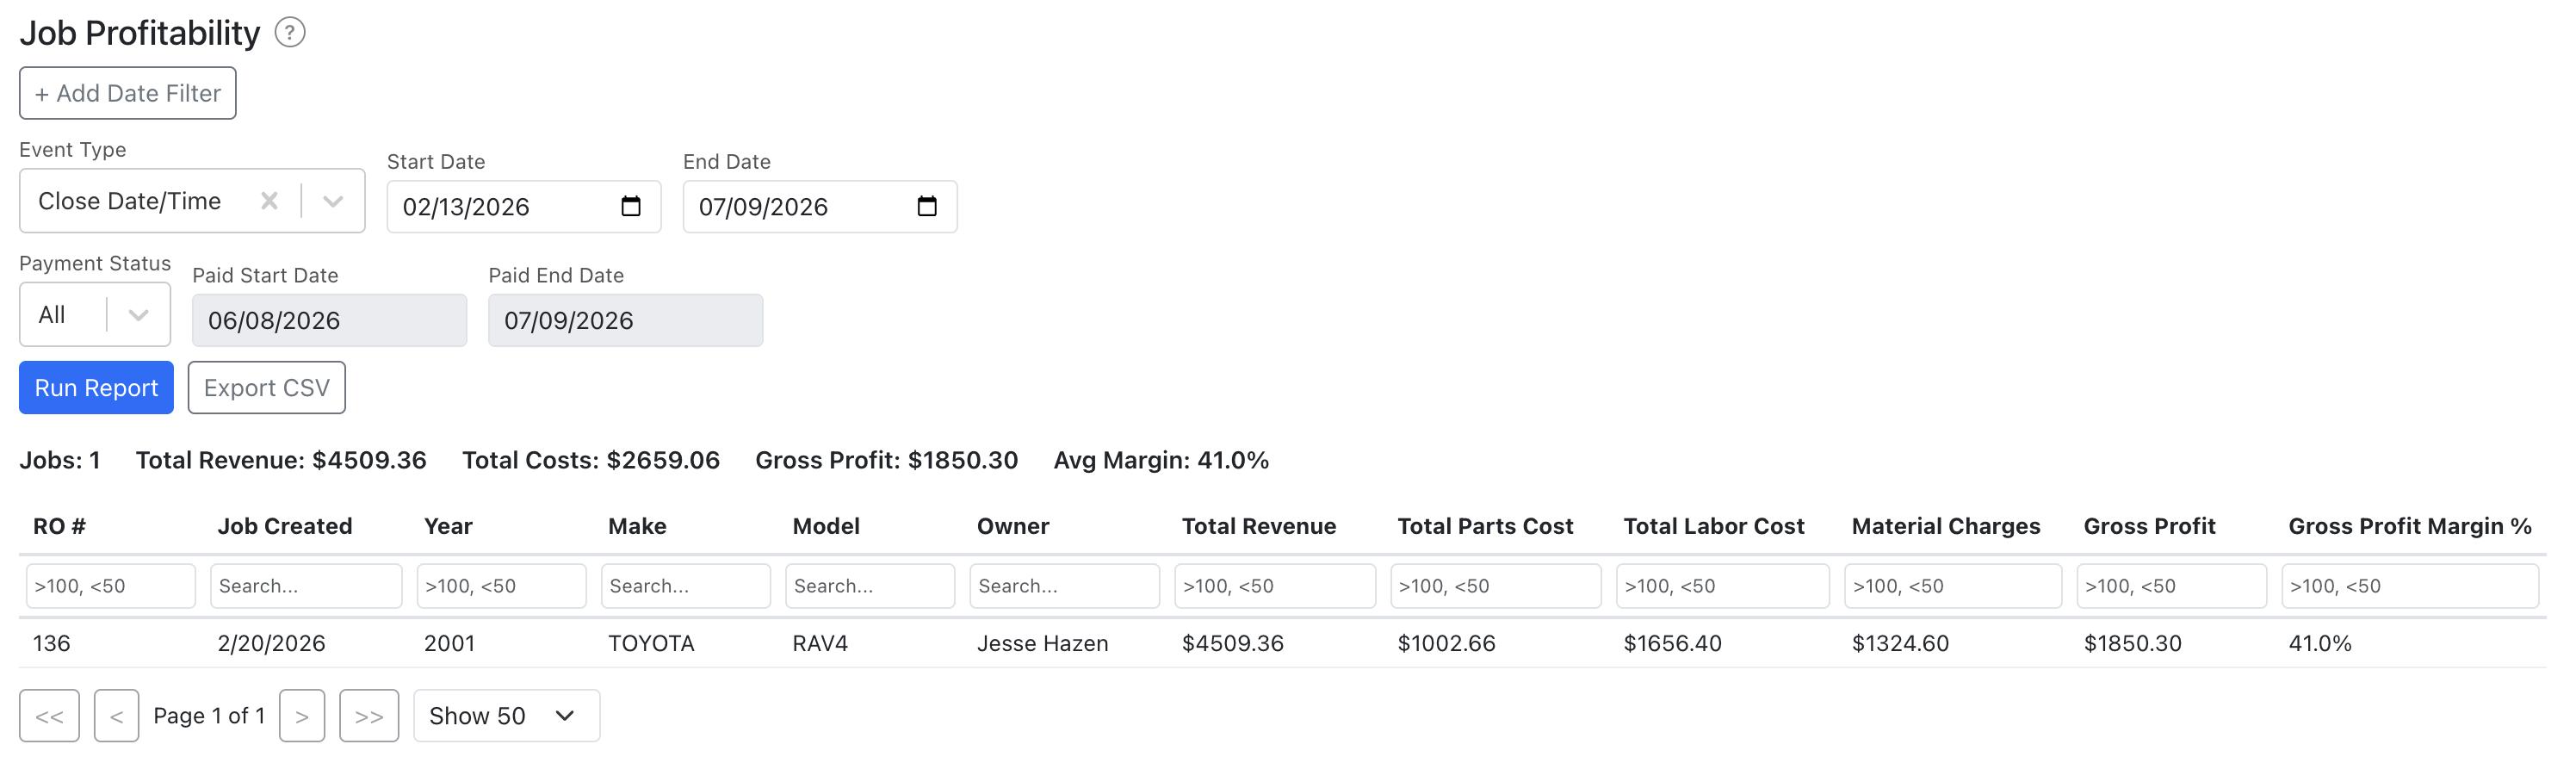
Overview: The Job Profitability Report shows per-job revenue, costs, and gross profit. Gross profit margin is calculated as gross profit divided by total revenue, expressed as a percentage (gross profit / total revenue × 100).
Running the Report
- Navigate to Reports from the side menu.
- Select "Job Profitability" under the Profitability category.
- Configure event date filters by selecting an event type and entering start and end dates.
- Select a payment status filter: All, Fully Paid, or Not Fully Paid.
- Click "Run Report".
Report Columns
- RO # — the repair order number
- Job Created — date the job was created
- Year — vehicle year
- Make — vehicle make
- Model — vehicle model
- Owner — vehicle owner name
- Total Revenue — total billed revenue for the job
- Total Parts Cost — cost of all parts on the job
- Total Labor Cost — cost of all labor on the job
- Material Charges — additional material charges applied
- Gross Profit — total revenue minus all costs
- Gross Profit Margin % — gross profit divided by total revenue as a percentage
Summary Statistics
Above the table, summary statistics display the total revenue, total costs, total gross profit, and average gross profit margin across all results.
Features
Rows with negative gross profit are highlighted in red for quick identification. The report supports sorting by any column header, pagination with 25, 50, or 100 rows per page, and CSV export via the "Export CSV" button.
Parts Margin Report
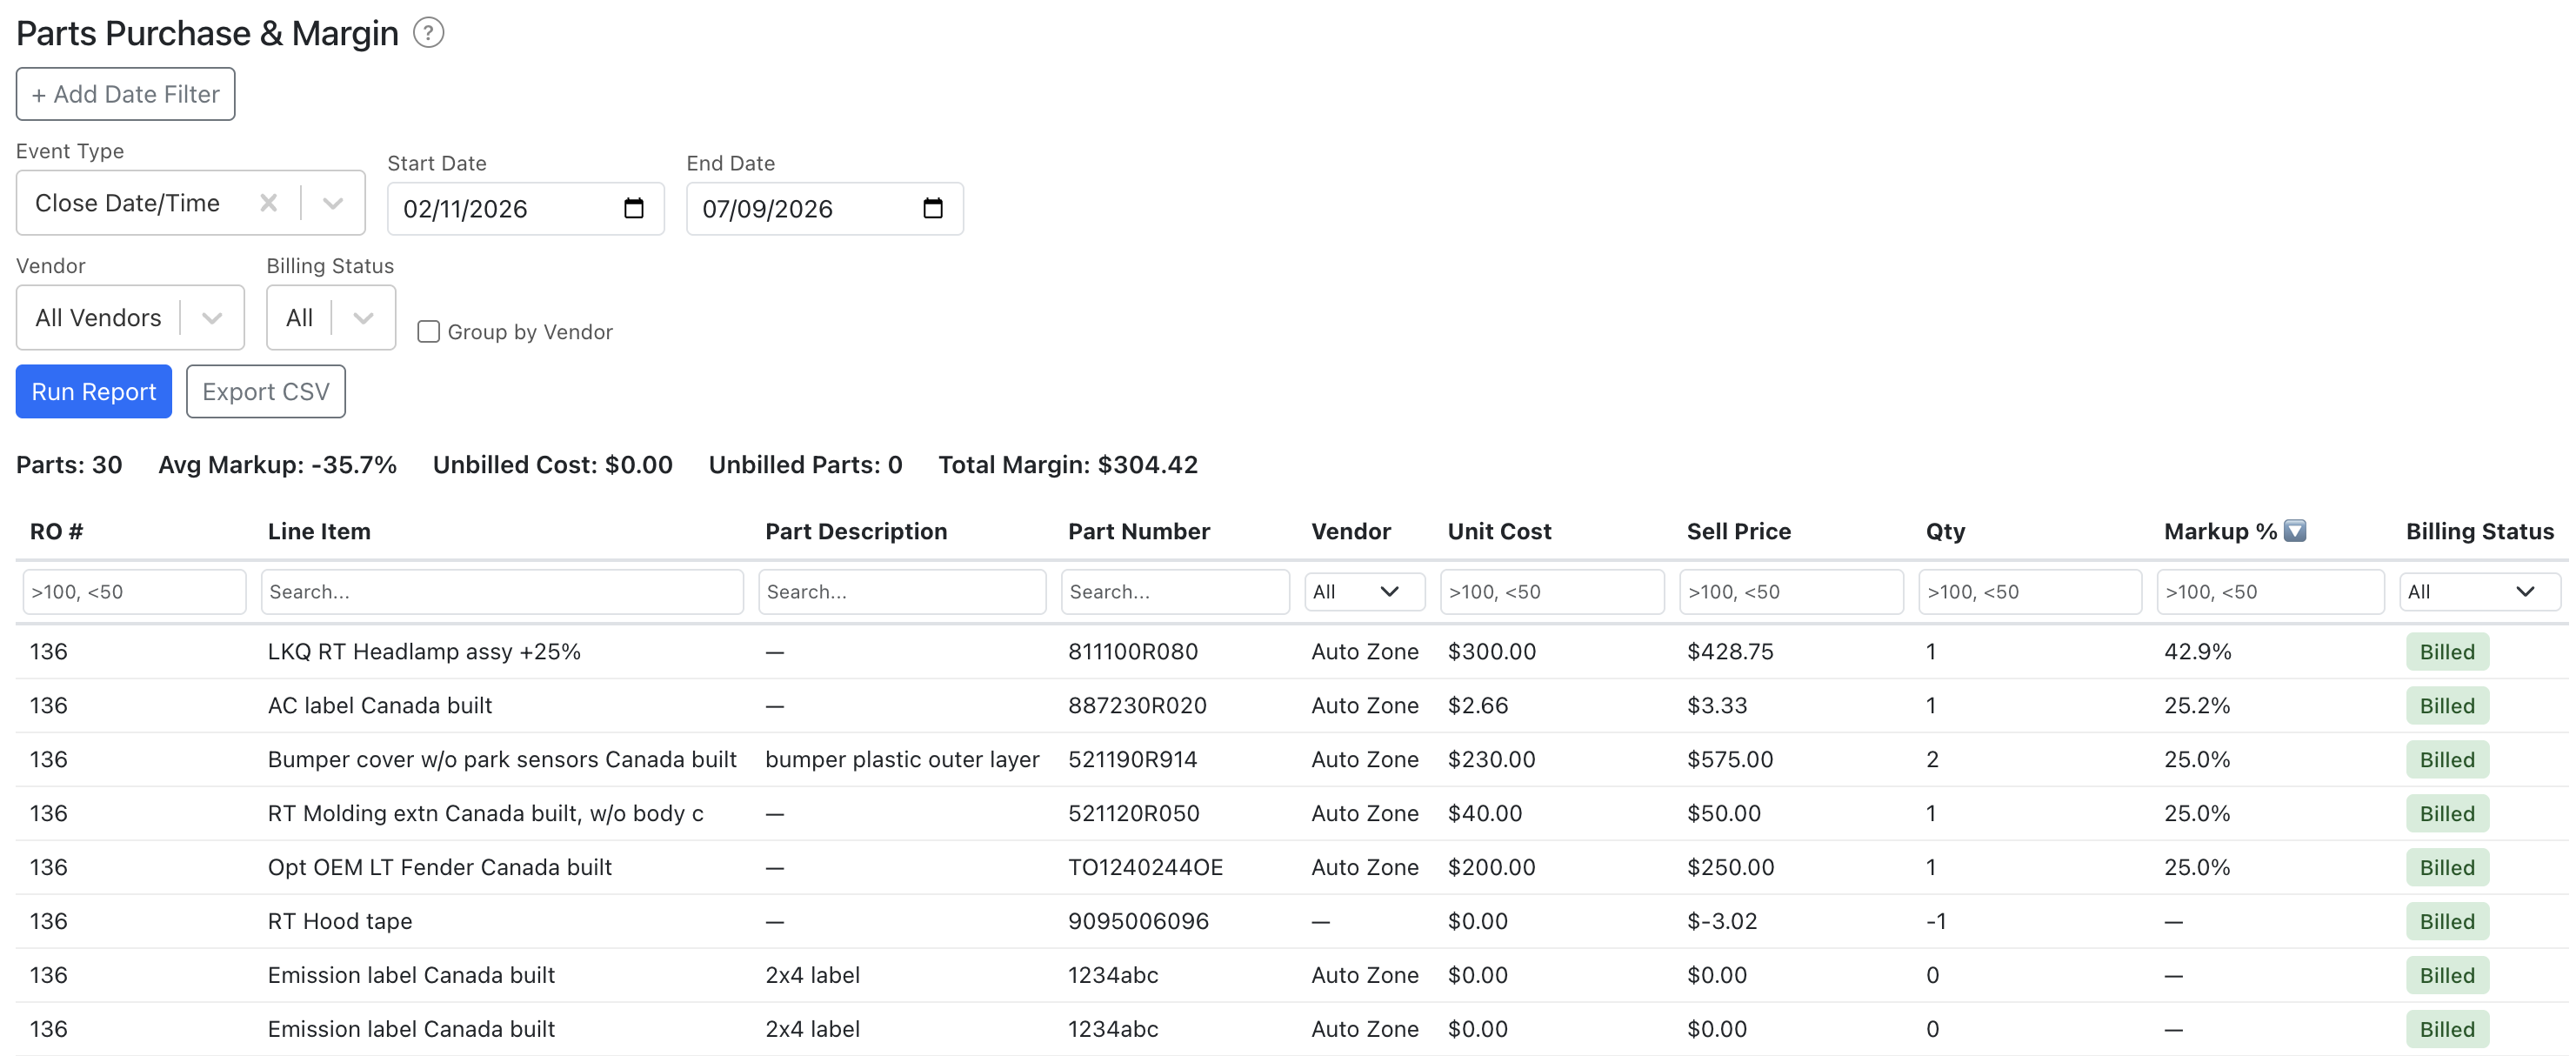
Overview: The Parts Margin Report shows per-part markup margins, billing status, and vendor comparisons. Markup margin is calculated as (sell price − cost) ÷ cost × 100.
Running the Report
- Navigate to Reports from the side menu.
- Select "Parts Margin" under the Profitability category.
- Configure event date filters by selecting an event type and entering start and end dates.
- Select vendor and billing status filters from the dropdowns.
- Optionally enable "Group by Vendor" to see per-vendor summary cards.
- Click "Run Report".
Report Columns
- RO # — the repair order number
- Part Description — name or description of the part
- Part Number — vendor part number
- Vendor — the parts vendor or supplier
- Unit Cost — cost per unit from the vendor
- Sell Price — price charged to the customer
- Qty — quantity of parts used
- Markup % — markup margin percentage
- Billing Status — whether the part has been billed
Summary Statistics
The summary displays the average markup margin, total unbilled cost, unbilled parts count, and total margin dollars earned.
Group by Vendor
When "Group by Vendor" is enabled, the report shows per-vendor summary cards with total cost, revenue, average margin, and unbilled parts count for each vendor.
Features
Billing status displays as colored badges: green for "Billed" and orange for "Unbilled". The report supports sorting by any column, pagination with 25, 50, or 100 rows per page, and CSV export.
Technician Performance Report
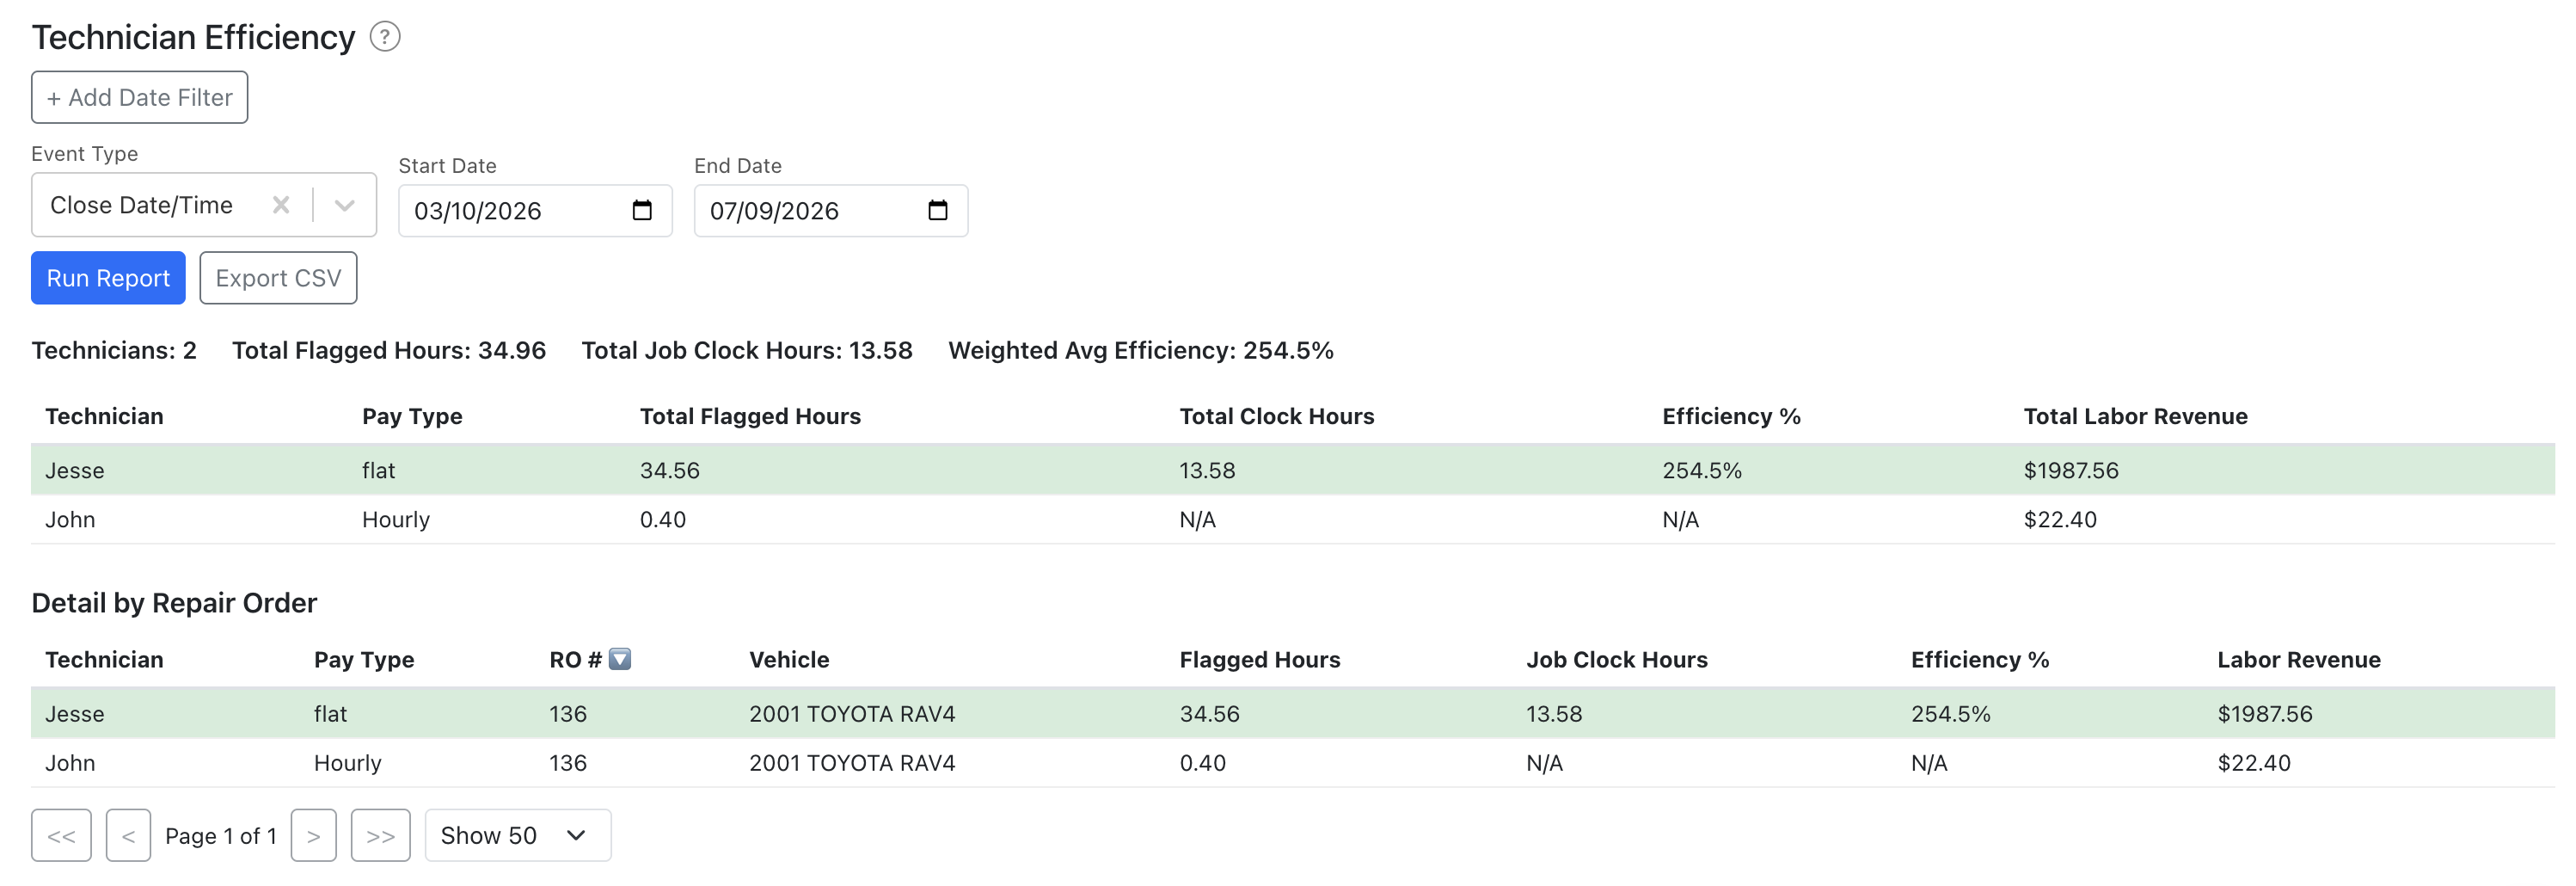
Overview: The Technician Performance Report compares flagged (billed) labor hours against clock hours to calculate an efficiency ratio per technician, and calculates the Effective Labor Rate (ELR) — the actual revenue collected per billed hour. Results are shown in both a per-technician summary table and a per-repair-order detail table.
Running the Report
- Navigate to Reports from the side menu.
- Select "Technician Performance" under the Profitability category.
- Configure event date filters (event type, start date, end date). You can add multiple date filters to narrow results.
- Click "Run Report".
Summary Table Columns
- Technician Name — the technician's name
- Pay Type — hourly or flat rate
- Total Flagged Hours — total billed labor hours
- Total Clock Hours — total time clock hours
- Efficiency % — flagged hours ÷ clock hours × 100
- ELR ($/hr) — Effective Labor Rate: labor revenue ÷ flagged hours. Shows what you actually collect per billed hour.
- Total Labor Revenue — revenue generated from labor
Detail Table Columns
- Technician — technician name
- Pay Type — hourly or flat rate
- RO # — the repair order number
- Vehicle — year, make, and model
- Flagged Hours — billed hours for that job
- Job Clock Hours — clock hours spent on that job
- Efficiency % — per-job efficiency ratio
- Labor Revenue — labor revenue for that job
- ELR ($/hr) — Effective Labor Rate for that specific job
Efficiency Calculation
Efficiency is calculated as flagged hours ÷ clock hours × 100. Values above 100% indicate the technician billed more hours than they clocked (common with experienced flat-rate techs). "N/A" means no clock data is available for that technician or repair order in the selected period.
Effective Labor Rate (ELR)
ELR is calculated as labor revenue ÷ flagged hours. It shows the actual dollar amount collected per billed hour, revealing pricing effectiveness independent of your posted door rate. Compare your ELR against your posted rate to evaluate discounting policies and labor pricing strategy.
Summary Bar
The summary bar displays technician count, total flagged hours, total clock hours, weighted average efficiency percentage, and overall ELR.
Features
Rows with efficiency above 100% are color-highlighted positively and rows with efficiency below 50% are highlighted as a warning. The detail table supports sorting by any column, pagination with 25, 50, or 100 rows per page, and CSV export.
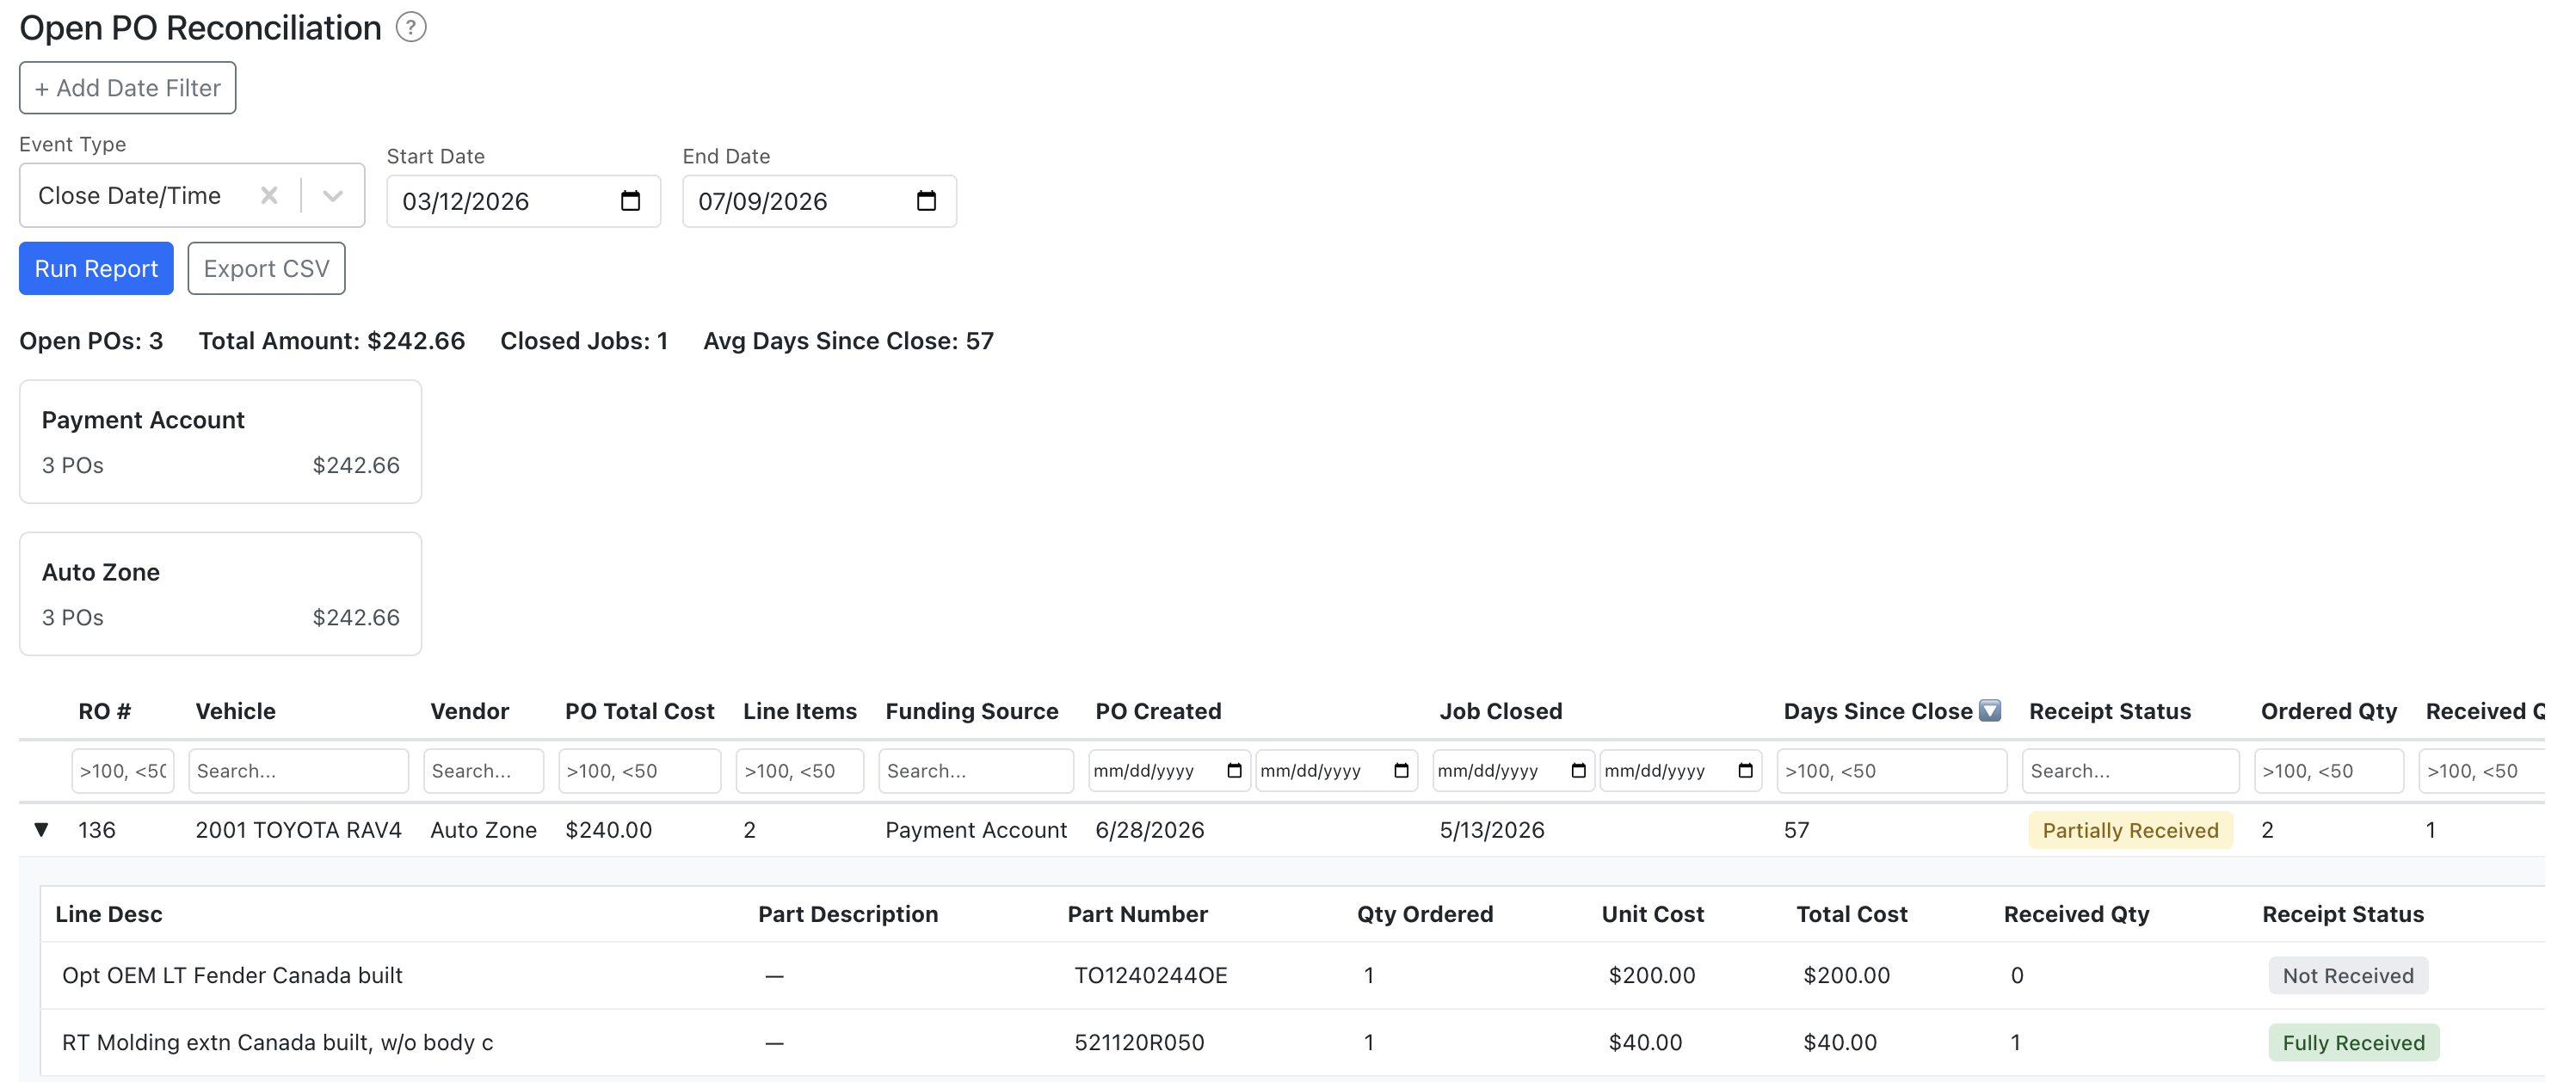
Open PO Reconciliation Report
Overview: The Open PO Reconciliation Report shows draft purchase orders that remain open on closed jobs. These represent unreconciled expenses that have not been pushed to QuickBooks.
Running the Report
- Navigate to Reports from the side menu.
- Select "Open PO Reconciliation" under the Accounting category.
- Configure at least one event date filter by selecting an event type and start/end date range.
- Optionally select a vendor filter from the dropdown.
- Optionally select a funding source type filter: Accounts Payable, Payment Account, or Manual.
- Optionally enter a minimum days since close value to filter by age.
- Click "Run Report".
Report Columns
- RO # — the repair order number
- Vehicle — year, make, and model
- Vendor — the parts vendor or supplier
- PO Total Cost — total cost of the purchase order
- Line Items — number of line items on the PO
- Funding Source — how the PO is funded (AP, Payment Account, or Manual)
- PO Created — date the purchase order was created
- Job Closed — date the job was closed
- Days Since Close — number of days since the job was closed
- Receipt Status — whether items have been received
- Ordered Qty — total quantity ordered
- Received Qty — total quantity received
Summary Statistics
Above the table, summary statistics display the total open PO count, total dollar amount, distinct closed job count, and average days since close. Additionally, a funding source breakdown shows count and dollar amount per type, and a vendor breakdown shows vendor name, count, and dollar amount ordered by total descending.
Expandable Row Detail
Each row can be expanded to show individual line items with the following columns: Part Description, Part Number, Qty Ordered, Unit Cost, Extended Cost, Received Qty, and Receipt Status.
Actions
After identifying open POs, you can take one of three actions: finalize the PO by navigating to the job detail, delete the PO if it is no longer needed, or leave it open for later reconciliation.
Features
Receipt status displays as colored badges: green for fully received, orange for partially received, and gray for not received. The report supports column sorting, pagination with page size options of 25, 50, or 100 rows, and CSV export via the "Export CSV" button.